One of the key indicators of a well-executed employee survey is its completion rate. After all, we need to hear what employees have to say from ALL sectors and work families within the organization. Completion rates reflect how accurately we hear what all of our employees say. In our last nationwide worker study, employees cited they complete and submit their employee surveys, on average, 77% of the time. Self-reported data like this tends to have what we call a halo effect—and it is usually reported high. True response rates are likely south of those reported.
Regardless, when creating an employee survey, we maintain good response rates by instituting a number of best practices. First, surveys need to be of a reasonable length. If there is a high degree of trust and a great level of communication within an organization, a longer survey is acceptable because the desire to carry on a survey conversation can make for great response rates. In an environment where employees know the survey conversation is valued by all, and more important, will be listened to—a longer survey can be used. When all feel a survey will be used by leadership and management in growing the organization into the future, a longer survey can be successful. Considering all that, an effective rule of thumb is to develop a survey with 25-30 closed-ended question items, and one or two open-ended questions. Surveys longer than this could impact response rates negatively.
The study revealed that female employees have the highest response rates, at 80%, compared to 71% for male employees. Survey length seems to play a role and be related to response rates as 80% of male employees felt that at least one of the employee surveys they took in the last year was, “too long.” However, only 71% of female employees cited having taken at least one survey in the last year that was, “too long.” There was a definite relationship across a number of demographic segments: If the employees feel the surveys are too long, their response rates tend to be lower. However, the decline in response rate due to employees taking surveys that are cited as, “too long,” is single digits.
According to the last two nationwide survey waves, conducted in Q1 and Q2 of this year, the real culprit that appears to drive nonresponse is found at the heart of the marketing mantra of many survey-technology providers: more frequent surveys are better. Survey-technology marketers often tout that given the technological capability of administering lots of surveys, we should field lots of surveys. It has become a convention in the industry: business and operations change quickly in this digital world, and if we are going to be able to respond to that fast-moving change, we better be surveying our people…more often.
Survey frequency has become convention, and we are urged to do it because we can. Despite the marketing hype that promotes frequent employee surveys, we have identified there is a tipping point of survey frequency, where response goes South, big time.
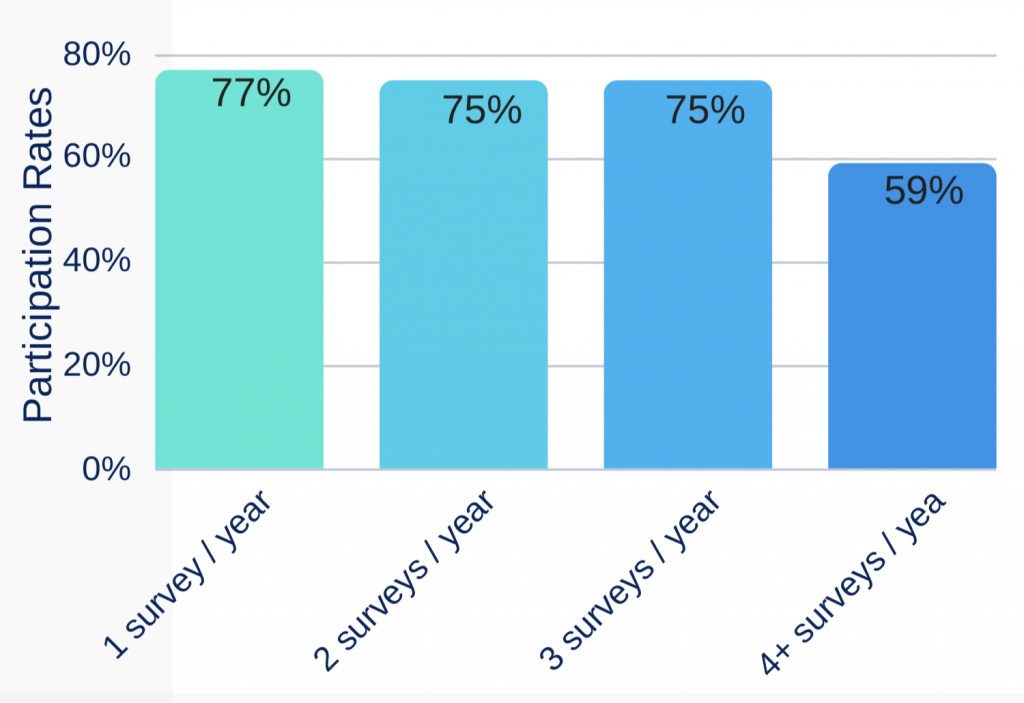
Nonresponse to surveys increases significantly when employees are given four or more (4+) surveys per year. And this four-or-more surveys per year seems to be the tipping point. On average, companies in America survey their employees 1.5 times a year. As cited earlier, on average, 77% of the American workforce completes and submits their surveys. When employees are surveyed two or even three times in a year, their response rates go down, but only slightly—single digits.
However, only 59% of the employees who were surveyed four or more times over the past year, completed and submitted their surveys. The response rates for employees surveyed four or more times a year decreased 24% below the average employees who took one or two surveys a year.
By increasing survey frequency, we are told we increase the information we receive from our people. That appears to be a fallacy. In reality, when you increase the survey frequency to four or more surveys a year, you significantly decrease the information you receive from your employees. You lose 24% more information if you survey your employees four or more times a year rather than once or twice. Based on the surveys of 10,000 workers, when you increase the survey frequency to four or more times a year, you significantly increase your nonresponse bias and you lose valuable insight into your employees’ feedback and overall engagement.
The data is clear. If the survey questionnaires are thoughtfully developed, and employees trust their survey conversation is important to a leadership that is listening, an annual engagement survey with possibly a second measurement or pulse survey executed mid-year, will well-serve the organization and its people.
All things considered, conducting surveys too frequently—quarterly or more often according to our research—results in less employee information, not more. In the case of employee-survey frequency, less is more.
METHODOLOGY STATEMENT & ERROR RANGE
In July, 2018, Fairfield Research conducted an online survey of a national probability sample of n=5,000 adult workers in America. Respondents were stratified by gender, age and Census Region, according to the latest Census estimates. The maximum error range of the study is 1.4% at the 95% Confidence Level.