What You Need to Know
One of the first metrics analyzed within any employee survey is the response rate. Let’s explore more about what response rates are, typical response rates across industries, what might influence response rates, as well as practices to increase response rates.
What Is a Response Rate?
One of the first key metrics analyzed within any employee survey is the response rate. Response rates are calculated by the number of surveys submitted divided by the number of employees invited to participate in a given survey.
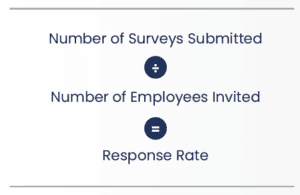
A response rate represents a measurement of the quality and thoroughness of the data.
Strong response rates provide confidence that the data is representative of an organization’s workforce population. Low response rates, on the other hand, can impact the reliability and validity of the employee data, which can lead to a misalignment of the leadership’s response. A low response rate also places limitations on managers when attempting to share results with their team as a means to inform and drive positive change. In most cases, an anonymity threshold is set at a minimum of five responses, placing restrictions on groups that do not achieve the minimum number of responses needed to report out. That limits a manager’s ability to work with their own data. In those cases, team results are aggregated with other respondents and reported at higher levels in the organization that do meet the minimum responses required.
What Is a Good Response Rate for an Engagement Survey?
When investigating the response rate for annual census surveys (excluding pulse, lifecycle, and other surveys) within WSAdata, the average global response rate was found to be 76%; the typical range of response rates is between 60% and 92%. This current average response rate is lower than what was seen in previous years where the average response rate was around 80%.
What Impacts Response Rates?
One of the major factors influencing response rates is access to taking the survey online. Organizations with a large number of employees who do not have easy access to a computer can generally expect lower response rates. Figure 1 identifies lower response rates for many of the blue-collar industries (e.g., transportation, warehouse, and utilities). Within some work environments, such as manufacturing plants or retail, it is difficult to create structured time to step away from the job to take the survey. But the investment is worth it, and many employers have found this to be an effective practice to ensure employee voices are heard. Examples of options include shared kiosks within the workplace or having employees utilize a shared computer, both of which could be done before, during, or after their shift. With some survey providers, SMS text messaging is an option where employees receive a text with the link to complete their employee survey. This option is particularly useful for those employees who may not be assigned a work email address. QR codes are another distribution option that can create a way to gain access via smartphone or tablet to complete the survey.
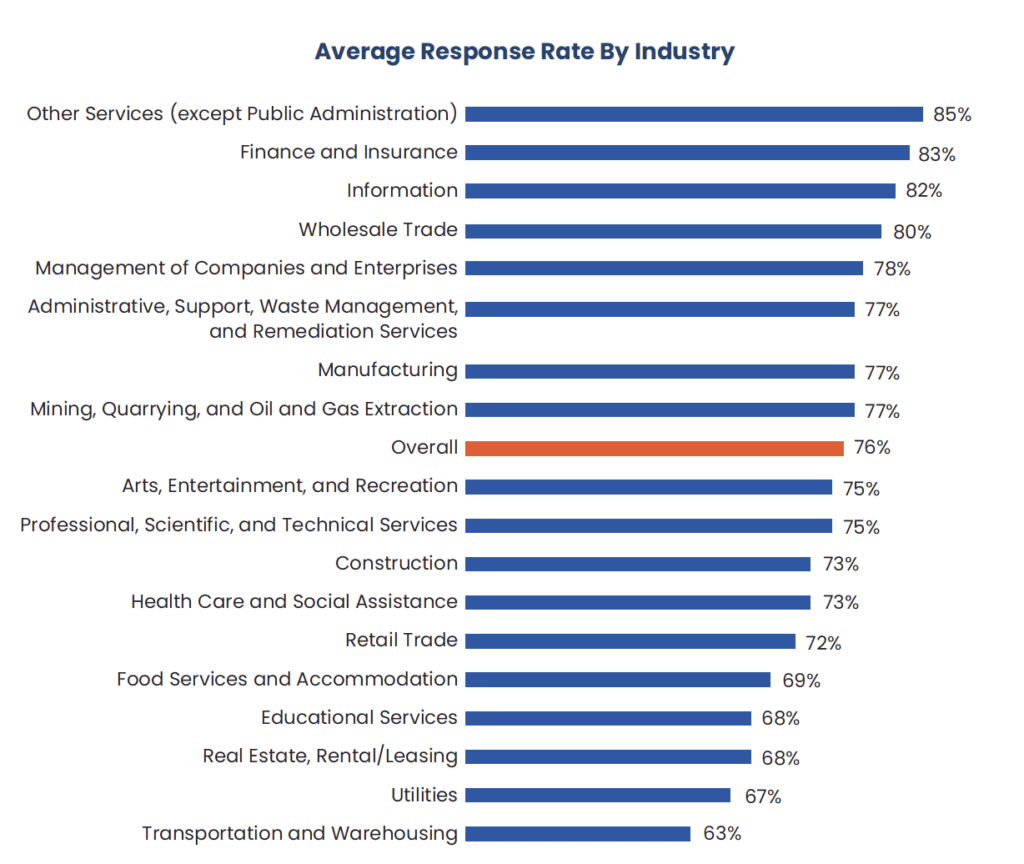
Figure 1. Response Rate By Industry
Another factor that can influence response rates is trust within an organization. If employees do not feel a high degree of trust that their opinions will drive change or that their responses will remain confidential, they are less likely to take the survey. This can become particularly true if employees have not seen action taken based on previous surveys. It is critical to effectively communicate the purpose and process of the survey, as well as reinforce prior survey action based on employee feedback. It is important to note that the guidance within this paper references annual census-type projects. Response rates for pulse surveys are typically lower (50% to 60%) because they often lack the same degree of communication and allocation of resources that come with annual, more publicized engagement surveys. Lifecycle surveys, such as onboarding and exit, are also excluded from this analysis given their differences and the “ongoing” nature of the feedback as opposed to “point-in-time” surveys. Lifecycle listening programs suggest high response rates for onboarding surveys often above 80% – but considerably lower for
exit surveys (30% to 50%, depending on timing of survey invitations).
What Can be Done to Improve Response Rates?
- Actively publicize the survey.
Communicate information about the purpose of the survey and how the information collected will be used (e.g., action planning to drive positive change). Hang posters throughout the organization that generates excitement and/or visually publicize the upcoming survey through digital platforms. - Ensure strong leadership communication.
Two to three weeks prior to launch, senior leadership should introduce the survey and communicate their support for the program, letting employees know the importance of their participation and how the results will be used. - Reinforce with manager communication.
Prior to the survey and throughout administration, managers should reinforce to their teams the importance of employee participation and how their opinions matter in making the organization a better place to work. - Ensure employees clearly see action taken from previous surveys.
Whenever a survey-driven initiative or change is put into place, remind employees that the actions taken were a result of their feedback. When employees feel they are being heard, they are more likely to participate in future surveys. • Keep the survey to a reasonable length. Unusually long surveys can lead to the experience of survey fatigue as respondents complete the survey. We recommend keeping census surveys between 40 and 50 items. - Track response rates and provide updates.
HR generalists or survey coordinators can identify units with low response rates and contact the responsible manager to increase responses. Introducing friendly competition among divisions is also a reasonable consideration for driving high response rates. - Send reminder emails to complete the survey.
There is almost always a spike in the response rate on the days that reminder emails are sent. Jumps of 5% to 15% are common. Figure 2 represents an average response rate pattern for a survey administered over the course of two weeks.
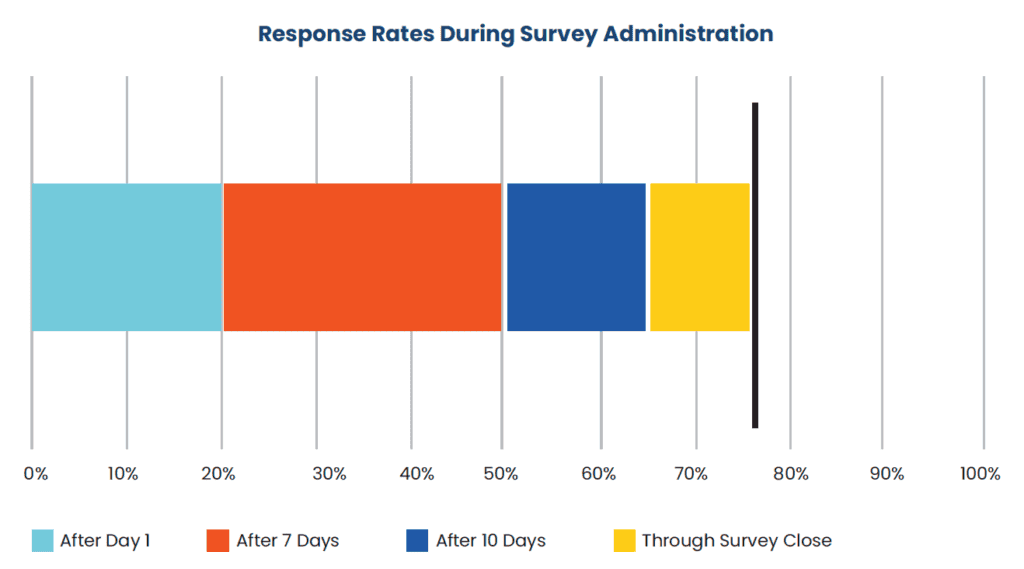
Figure 2. Response Rate By Day
- Administer the survey over a reasonable period of time (two weeks).
Allow employees ample opportunity to participate. Covering multiple weeks ensures that someone taking vacation for a week will still be able to participate in the survey. Many surveys start mid-week, so that the administration spans the portion of three work weeks. - Reinforce that survey data is confidential.
Let employees know that responses will not be tied back to particular individuals and that all scores are only shown in aggregate (e.g., five or more respondents). If confidentiality is a concern for your organization, consider increasing the minimum to 10, 30, 50, or 100.
Conclusion
In conclusion, there are a lot of factors within the control of management, leadership, and project teams to help drive response rates for engagement surveys, which we know leads to more reliable, informative, and impactful data. Therefore, it is important to get it right by investing the time, effort, and involvement throughout the organization to give everyone an opportunity to have their voice heard as a means for driving positive change.
Authors and Content Contributors: